Google Analytics Connection to Varify via Google Auth
In short
When you connect your Google Analytics property in your tracking setup, you can analyze your experiments directly in Varify using the built-in reporting features. In this post, you'll learn exactly what happens and what benefits you'll gain from it.
Setting in the Tracking Setup Wizard
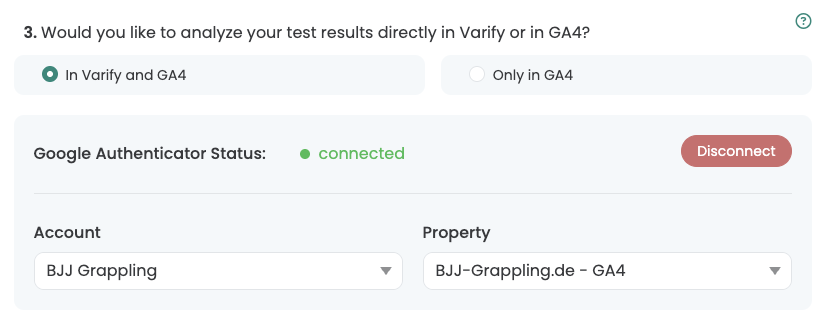
In the Tracking Setup Wizard, you'll be asked whether you want to analyze your experiment data in “Varify and GA4” or only in “GA4.” If it's enough for you to analyze your experiment results exclusively in GA4 using explorations, then you can select “Only in GA4.”.
Setting in the Tracking Setup Wizard
In the Tracking Setup Wizard, you'll be asked whether you want to analyze your experiment data in „Varify and GA4“ or only in „GA4.“ If it's enough for you to view your experiment results exclusively in GA4 on Exploration To analyze the data, you can select “Only in GA4.” If you select “In Varify and GA4,” Varify imports your experiment data from Google Analytics and displays it in an experiment report.
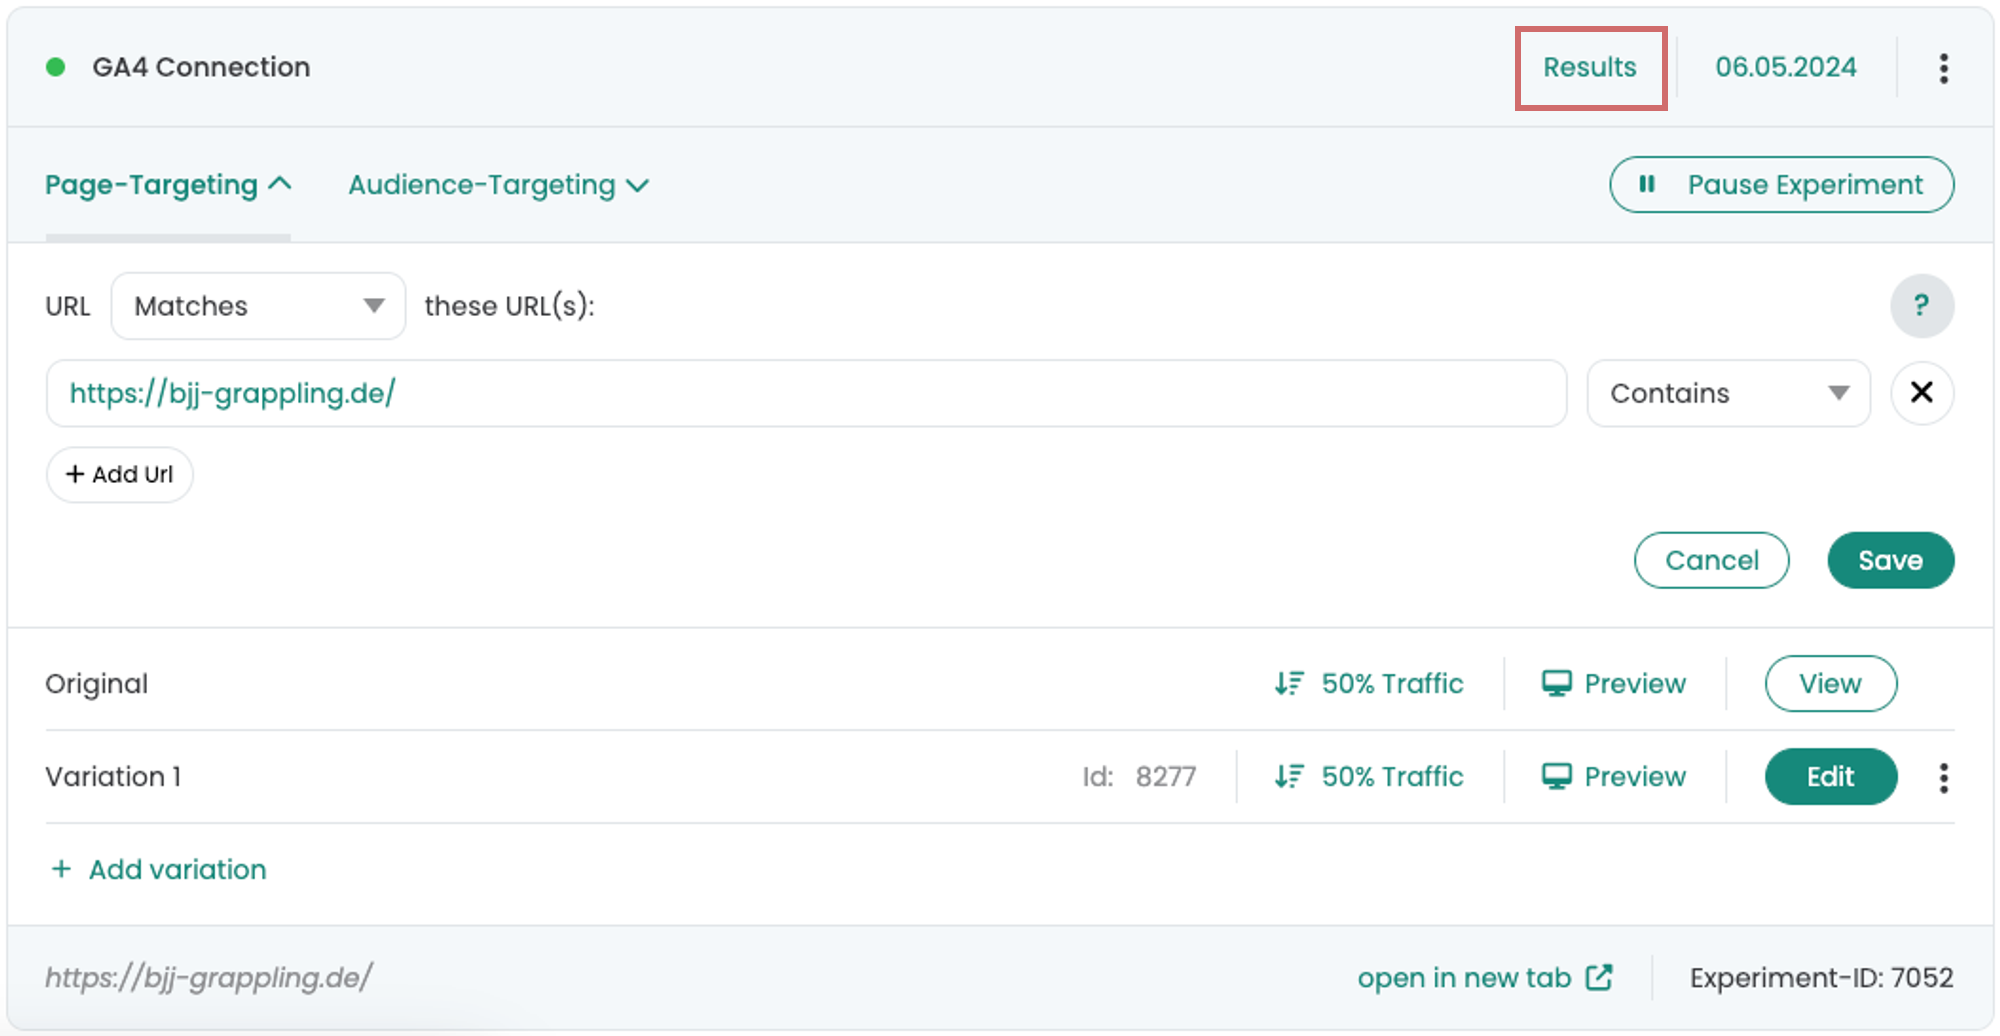
Connection to Google Analytics 4 via Google Auth
Once you've selected “Varify and GA4,” you'll be prompted to connect to Google. To do this, you can either sign in with your personal GA4 account or use a GA4 service account. To do so, click on Sign in with Google. Whether you connect using your personal GA4 account or a service account, make sure the account added to Google Analytics has at least Editor permissions. These are required so that Varify can create audiences in GA4, which are used to import experiment data from GA4 into Varify.
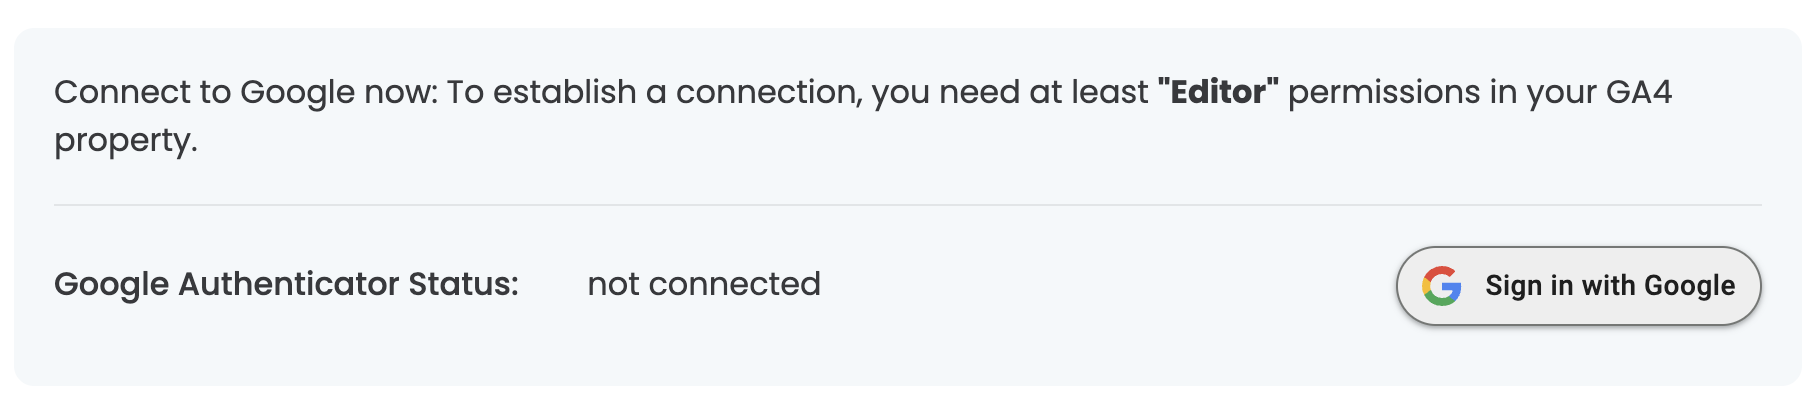
To do that, click
Link to Your User Account
Once you've selected “Varify and GA4,” you'll be prompted to connect to Google. To do this, you can either sign in with your personal GA4 account or use a GA4 service account. To do so, click on
Connection to Service Account
Creating the report
You can add various Google Analytics goals on the report page.
- To do this, click on „Add new goal“.
- Select the metric you want to evaluate from the list. You can find revenue goals in the „Revenue“ tab.
- Then click on „Add Goal“. After a short moment, the goal will appear in the report.
You can assign several metrics, key events or events to a report. Each selection is displayed separately as its own goal in the list.
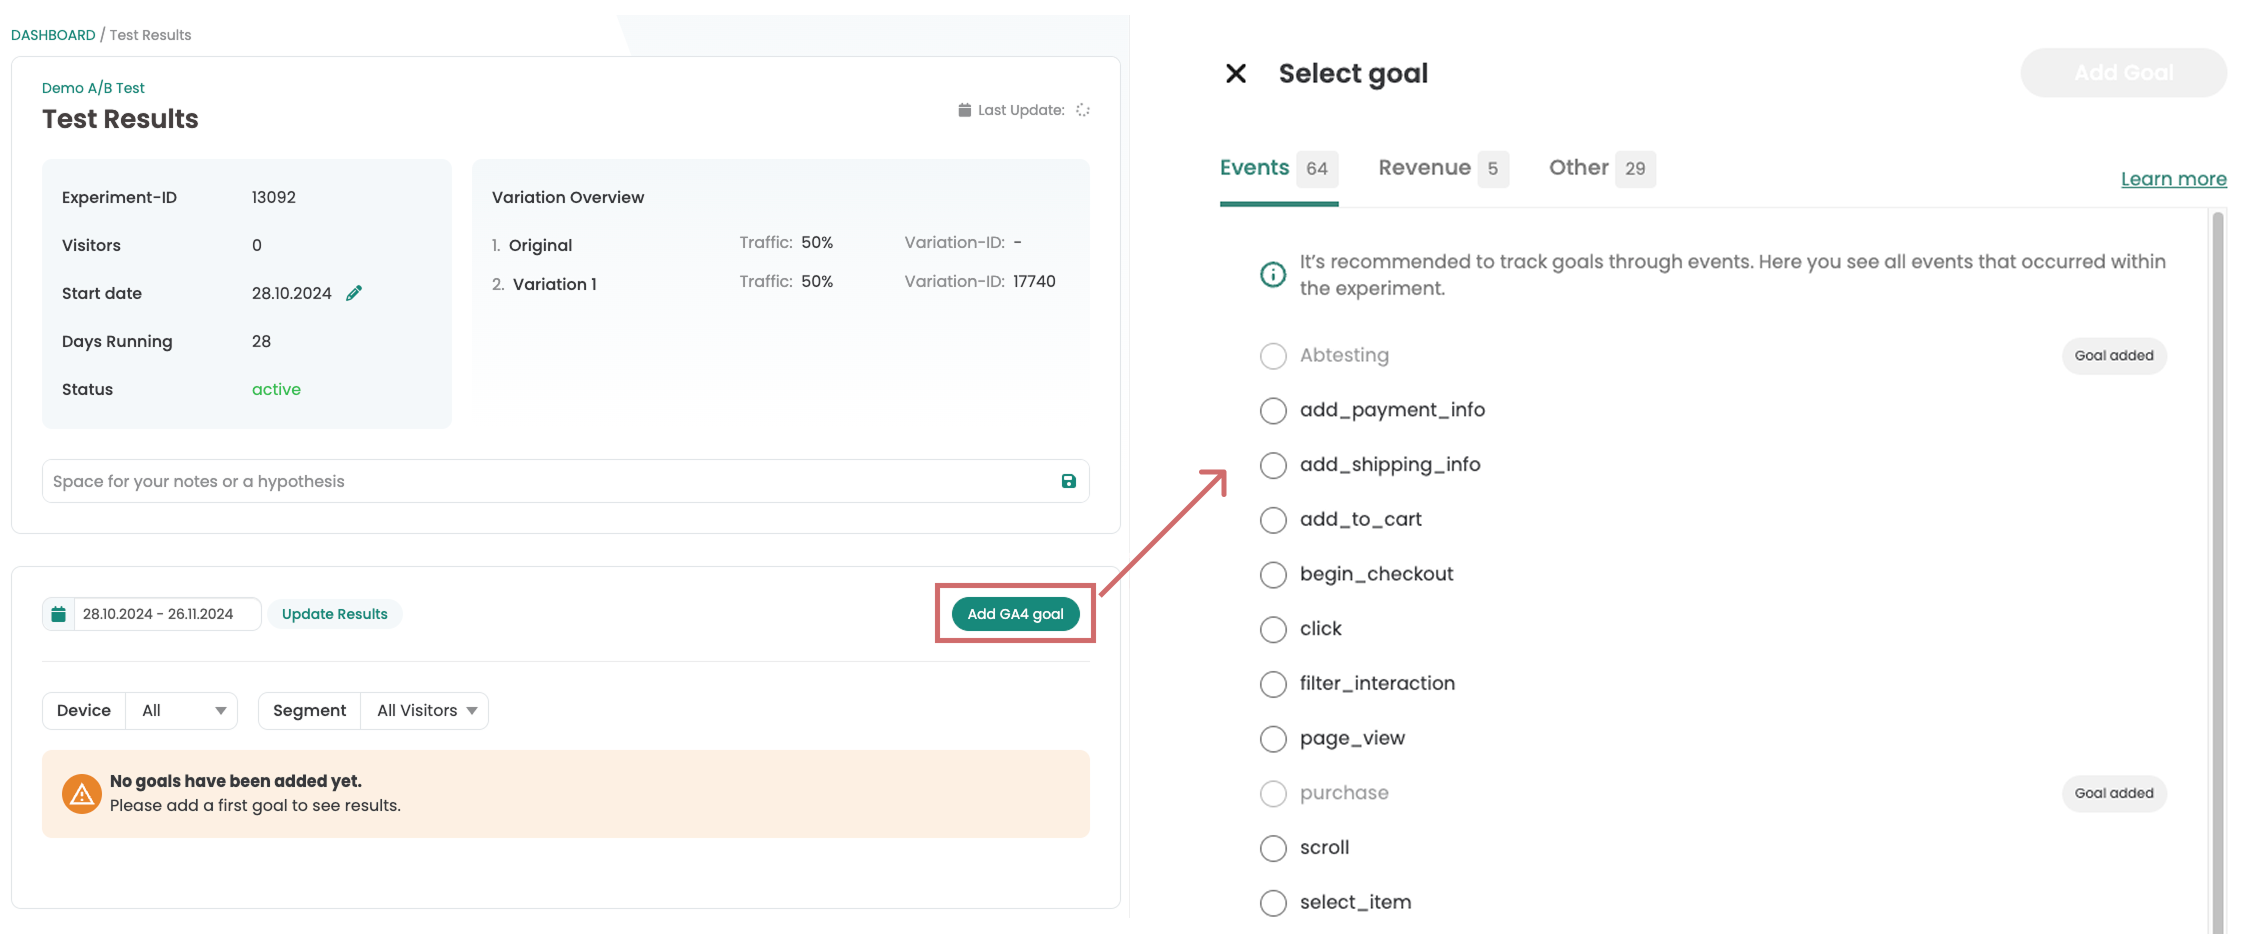
Notice: After starting the experiment, it can take up to 24 hours until the first events are available for selection.
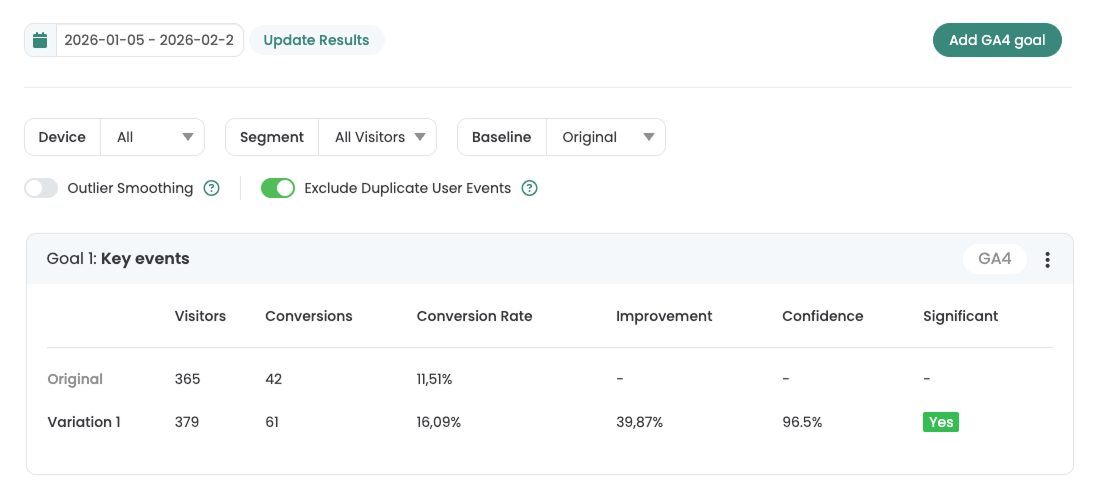
The goal has been added to the report. For each goal, Varify compares the metrics between the variants. For each variant, the number of visitors is set in relation to the measured metric and displayed as the conversion rate. You can also see the improvement as well as confidence and significance.
Customize and filter the reporting
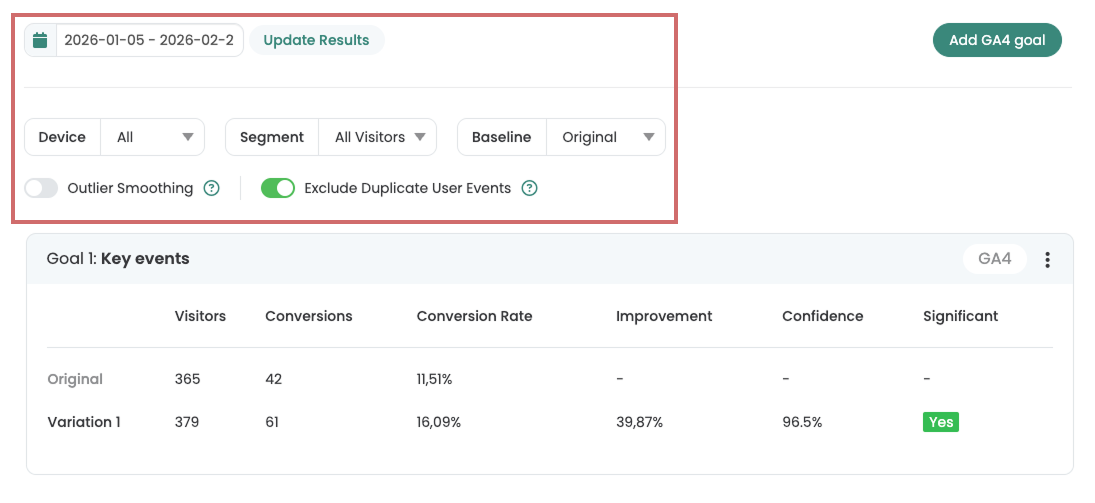
You have various options for customizing the reporting. Use the date slider to set the time period. By default, „Experiment start to current date“ is selected.
You can also use the following filters and segmentations:
| Filter/Segment | Explanation |
|---|---|
| Device | Segmentation by device category: mobile, desktop, tablet. |
| Segment | Segmentation by visitor type: all visitors, new visitors, returning visitors. |
| Baseline | Improvement, confidence and significance are based on the selected baseline (standard: „original“). |
| Outlier Smoothing | Filter outliers in revenue targets to avoid distortions caused by very high orders. |
| Exclude Duplicate User Events | Events per user are only counted once by default, even if they are triggered multiple times; if this option is deactivated, triggers are counted multiple times. |
We have all filter and segmentation options here described once again in more detail.
Evaluation of the test results
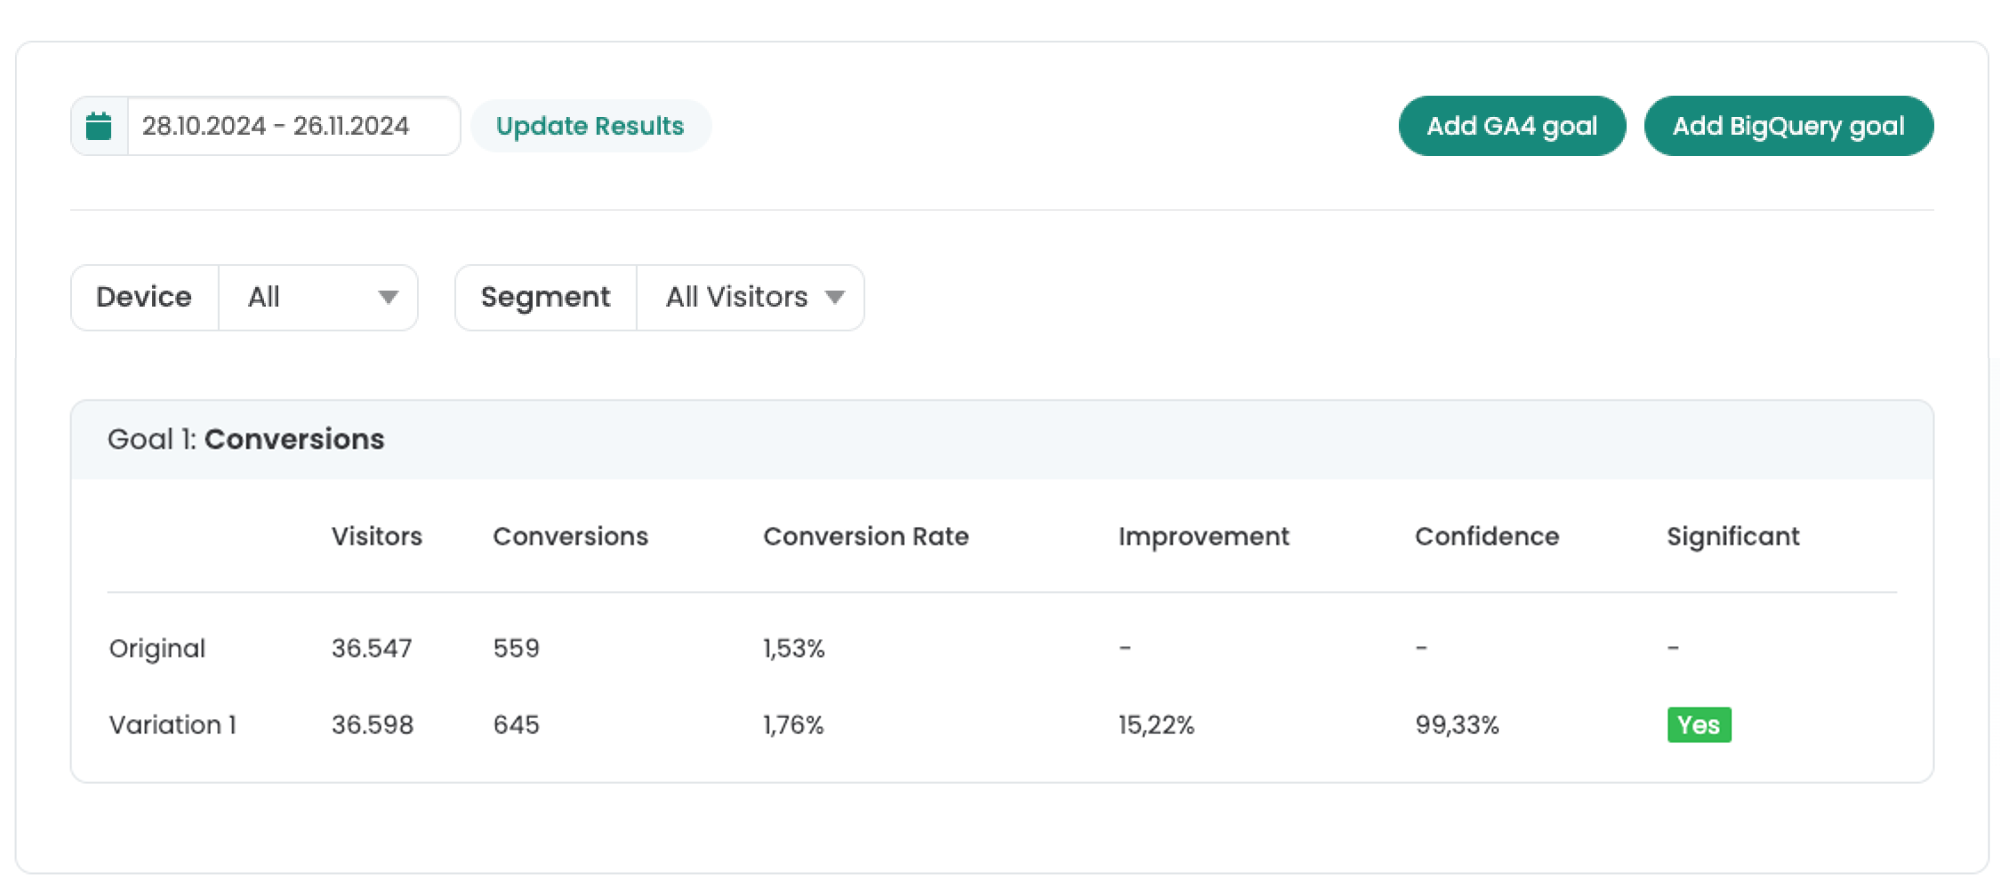
A conversion rate and an uplift are calculated based on the number of visitors in the variant and the values of the selected metric.
To check whether your experiment is statistically significant, you can use the confidence level for the evaluation. Variants with a confidence level of 95 % or higher are highlighted with a green "Yes".
Pin primary goal and goals
For a better overview in reporting, you can define a primary goal and/or pin goals at the top.
Primary Goal
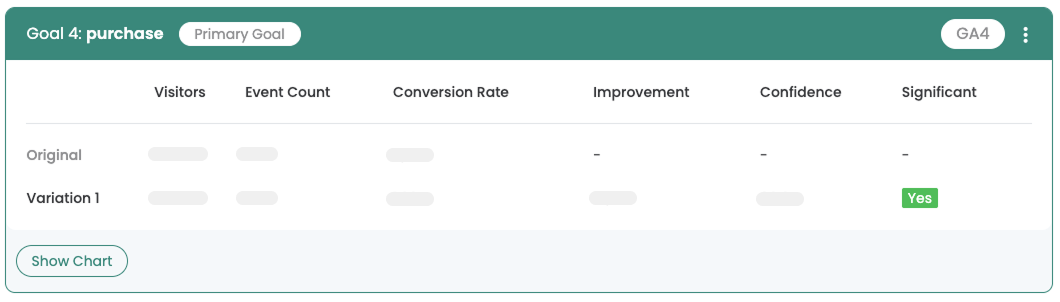
The primary goal is the main metric of your experiment. You can mark any goal you add as the primary goal, but only one is possible at a time.
How to set a primary goal:
- Click on the pencil icon in the reporting overview.
- Select the primary goal.
- Save with the floppy disk symbol.
The primary goal is always displayed at the top in green - even above pinned goals.
![Test results overview; an arrow points at the „Primary Goal“ list where „[GA4] purchase“ is selected.](/assets/images/cms/docs/ga4-connection/Group-3025.png)
Pin Goals
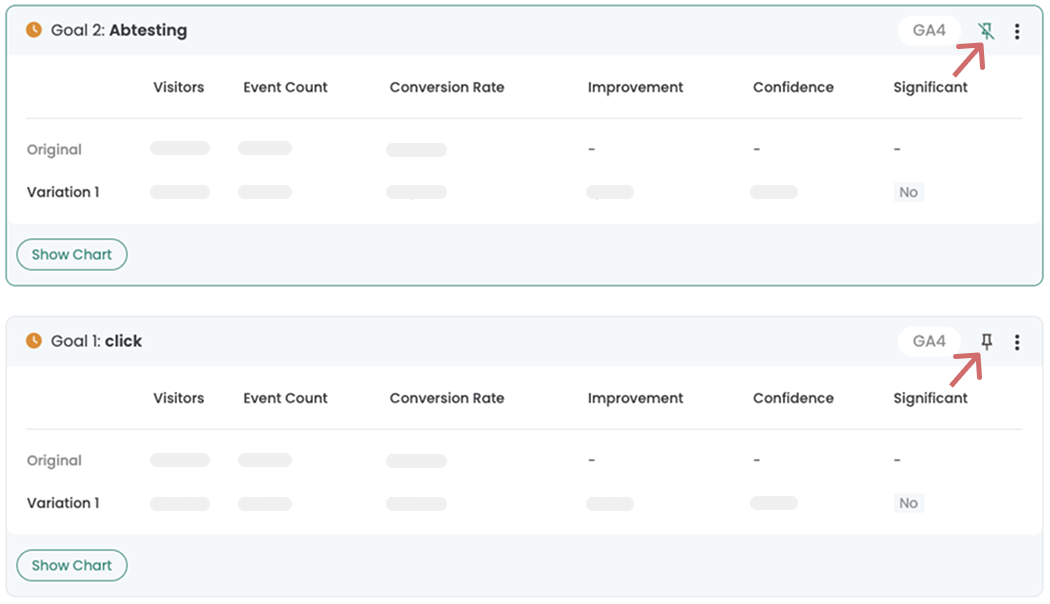
You can pin goals. They then remain at the top of the reporting, even if you add new goals. This means you always have the most important goals to hand.
How to pin a goal:
- Click on the pin at the top right.
- To release, click on the pin again.
Pinned goals remain at the top and are marked with a green frame.
BigQuery, Shopify or PostHog in Varify Reporting
In addition to the Google Analytics 4 Goals, you can also display the following web analytics key figures in Varify Reporting:
| Filter/Segment | Explanation |
|---|---|
| Google Analytics 4 | As described in this article, you can display GA4 events in Varify Reporting. |
| BigQuery | If you use BigQuery in conjunction with GA4 to analyze your raw data, you can also use Varify Reporting with BigQuery numbers. Learn more |
| Shopify | In Varify Reporting, you can use your Shopify figures live for analysis. To do this, you need a GA4 tracking setup and our Shopify tracking integration. Learn more |
| PostHog | If you use our PostHog Tracking integration, the figures are available for analysis in Varify Reporting. Learn more |